What is Business Process Mapping
Processes are at the heart of every business. To do things properly, data must go across the workplace in a specific order, whether it’s employee onboarding or purchase orders.
What would the process flow look like if you asked your team members to draw it out for you? Something like an architect’s blueprint, or a jumble of squiggly lines and question marks?
This is where the concept of business process mapping comes in handy.
What is Business Process Mapping?
Business process mapping is a methodology for creating visual representations of work processes, making up a part of Business Process Management (BPM). Primarily, business process maps depict the relationship between the actions and inputs that create an end-product or service, such as when a product is packaged or an employee’s vacation is approved.
This documentation process is concerned with what a company does, why it does it, what the success criteria are, who is responsible, and when and where different phases will take place. Business process mapping provides transparency for all stakeholders, particularly those interested in compliance. Experts use flowcharts most often, along with Business Process Modeling and Notation (BPMN) symbols.
The terms “business process mapping” and “business process modeling” are frequently interchanged. When professionals do business process modeling, they are more concerned with how the processes are carried out and who (or what department) is carrying them out. As a result, they concentrate on assessing and optimizing the business process architecture by reviewing procedures and taking into account the company’s objectives and requirements. The process architecture of a company describes all of the company’s processes.
The architecture, often known as a “blueprint,” is used to connect a company’s processes with its goals. Modeling is primarily concerned with how processes move, whereas mapping is concerned with what already exists.
Charts, flowcharts, and symbols are used in business process mapping to address three key questions:
What are the tasks involved in the process?
Processes comprise individual tasks that must be completed in a specific order. When you map out a business process, you can clearly see each step and ensure that everyone knows where one activity stops and another begins.
Who is in charge of each task?
When sketching out a business process, you must determine who is responsible for each step. Task assignments can be static (Erica does it every time), dynamic (the initiator’s manager does it every time), or based on data in the form. However, business process mapping clarifies roles and responsibilities.
When does each task take place?
A process mapping tool will place each task in the proper order inside the overall process. Is it the first to happen? Are you looking for a new challenge? Is this activity capable of running concurrently with other processes, or does it require the processing of other data first?
With business process mapping, you can also specify deadlines and SLAs. When it comes to each step, how long should it take? Is it really only 24 hours? Is it really two business days? Do you determine it by the item’s priority?
Types of Business Process Maps
Business process maps come in a variety of shapes and sizes, ranging from planning activities to details, documents, goods, roles, locations, strategies, and interactions. There are also many levels of information available for mapping. The following are some examples of business process map types.
Flowcharts
These are visual representations of your procedures. Top-down flowcharts, deployment flowcharts, and detailed flowcharts are the three most common forms of flowcharts. The top-down flowcharts represent the steps of a process in a single flow, clustering them together.
Top-down flowcharts expand to include who is conducting each task in deployment flowcharts. Detailed flowcharts are a combination of top-down and deployment flowcharts that show as much information as possible.

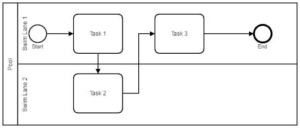
Swimlane Diagrams
The sub-process roles of a process are detailed in these diagrams, also known as cross-functional mappings.
State Diagrams
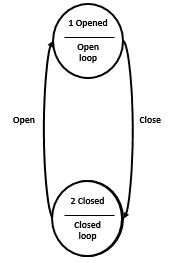
In the Unified Modeling Language (UML), these diagrams depict the behavior of systems by expressing the states of components.
Data Flow Diagram
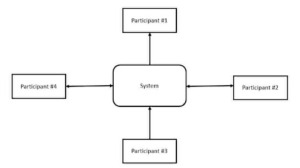
This diagram, like a flowchart, is primarily concerned with the data that moves through a system.
Value Stream Mapping
Value stream mapping is a part of Lean Manufacturing concepts that shows the current state of a process and aids in the design of the future state, with an emphasis on taking products and services from conception to completion.

Why Do You Need Business Process Mapping?
Business process mapping is an important aspect of running a successful company. With no visible depiction of how predictable operations function in your organization, employees are left to assume and make mistakes about what the best practices are.
If a company process isn’t clearly defined through mapping, each department and employee is left to devise their own sequence and assignments. When task owners are not properly assigned, this results in chaos, confusion, and blame.
Some other benefits include:
- Clarity on the process within the company.
- Controlling the process in a systematic way.
- Establishing operational guidelines.
- Eliminating redundancies.
- Improving process visibility.
- Improved adherence to industry norms.
- Employee training is more consistent.
How Do You Create a Business Process Map?
- Assemble all stakeholders.
You’ll need various people’s voices who are both in charge of the process and actively participating in the day-to-day operations. - Make a list of all human tasks.
What are the various activities that humans engage in as part of this process? Initially, sticky notes that may be readily moved around are frequently the best option. - Make a list of all of the system’s duties.
Many operations, such as data transfers, email sending, and simple folder creation, can be performed more efficiently by a machine than by a human. - Look for redundancies.
Return to your task list and see if any of them can be removed, changed to a notice, or transformed to a system task. - Define who is in charge of each task.
The majority of work will be assigned to a single person. Some tasks may be delegated to a group of employees, but someone should be held accountable for the timely execution of all tasks. System duties also require a point of contact in the event of any failures. - Arrange the tasks in a logical order.
What’s the first thing that has to happen? Is it possible to complete some jobs at the same time? Which of your tasks are reliant on others? When will the procedure end? While physical things such as movable cards are ideal for this phase, you’ll eventually want to switch to a business process mapping application that can digitize what you’ve developed.
Business Process Mapping Best Practices
Unfortunately, far too many professionals overlook process planning. Here are some pointers to guarantee that process mapping helps you get the most out of your improvement/innovation project.
1. Start With the Big Picture in Mind
It’s human nature to want to dive under the hood and start fixing things when we have a problem. Resist the urge to give in! Clarify objectives, analyze the corporate environment, and uncover external underlying causes, customer gaps, and stakeholders with a “systems thinking” approach. To get your project off on the right foot, we recommend using the System Map.
2. Get the Right Stakeholders in the Room
The System Map from the tip above will assist you in identifying all stakeholders, including external and internal suppliers, process performers, and internal and external customers. Consider your organization’s main decision-makers and influencers. If users reject the lessons and recommendations in a magnificent process map, it is meaningless.
3. Be Clear on the Business Objective
There are a variety of reasons to use process maps. Just think of DRIVER – which stands for Diagnostics, Regulatory, Improvement/Innovation, Value/Cost Analysis, Education, and Redesign (automation or transformation). Your business aim guides the tools and approaches you choose. A highly thorough value analysis chart, for example, would not be appropriate for new employee training or an executive presentation.
4. Choose the Right Technique
Technical nerds can become engrossed in standards debates (BPMN vs. UML), but when working with business experts, it’s easiest to adopt straightforward 20th-century communication approaches that are most effective. For example, a rectangle can represent an operation and a diamond can represent a decision point. Even with that simple notation, depending on your DRIVER, you can choose from a variety of maps and charts. Techniques like the top-down flowchart and cross-functional (swim lane) process map are particularly beneficial when the goal is regulatory compliance or education.
5. Look For Measurement Opportunities
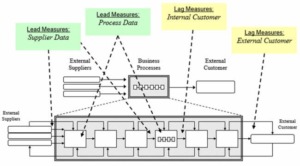
Because the primary purpose of a business process mapping project is to increase performance, measurement identification is a useful side effect. You can discover upstream “pulse points” through mapping. These are the points in the workflow where rework, handoff delays, or inspections may be necessary. Setting a consumer goal is simple. An important process improvement outcome is determining which upstream activities have the most impact on that goal. You’ll get a head start thanks to the metrics discovered during process mapping.
6. Start With Old-fashioned Paper and Post-its
Group gatherings may have become less popular in the post-COVID-19 environment. It’s preferable to do process mapping on the walls of a large conference room if you can get all of your stakeholders together. This increases participation, team dynamics, and brainstorming. Post-it notes and markers are high-touch tools that encourage collaboration.
Online meetings are a viable option if distance or policy prevent you from gathering your team in one location. If you’re going to use process mapping software, be sure it supports real-time collaboration (e.g. Lucidchart). Some apps allow you to “collaborate” with one person at a time. This isn’t collaboration; it’s version control.
7. Choose the Right Software
You’ll have to exit the conference room at some point. Not only for problem-solving, but also for continuing communication, engagement, knowledge management, and process improvement. The process mapping work outputs are invaluable. It’s crucial that you pick the right software for storing and sharing. If you utilize a media that isn’t easily accessible or usable, you might as well print up process maps and store them in a dusty binder on the shelf.
Consider your DRIVER once more.
If you want frontline personnel to utilize maps to learn “how to” and submit feedback to colleagues or process owners, a product like Nintex Promapp would be a good choice. Whereas, if you’re looking to automate your processes, IBM Blueworks or Signavio are better options. If the maps are for internal process experts (such as Green Belts), Signavio or interface may be the best option. These are only a handful of the possibilities. There are other excellent items on the market.
8. Validate and Socialize
One of the most crucial tasks in a mapping project is process validation. Too few consultants are willing to put in the time. It’s nearly impossible to design a perfect process map on the first try, especially if not every stakeholder can be present. Process validation allows all team members and other stakeholders to assess the work product and provide suggestions for improvements.
This not only improves accuracy, but also encourages participation and buy-in.
Stakeholders who were not present for the as-is or to-be process mapping are frequently skeptical of the results. It’s in our nature. People dislike change. Giving those people the opportunity to suggest improvements and add their own subtleties and expertise to the work product lessens opposition to process and technology changes.
9. Look to Improve and Innovate
There are two possible destinations while traveling from as-is to to-be. The “should be” state is a variation of to-be in which the current process is run with all of the cylinders blazing. There is no rework or waste. Employees have the skills, materials, and rules they need to provide value to customers quickly and efficiently. This is usually adequate to meet the company’s objectives.
Your “could be” state is the alternative option. This is the form of to-be in which a new method has been designed using technology. Because a “might be” solution necessitates greater investment (financial, political, and time), the subsequent performance improvement must provide a large return on investment (ROI) for the company.
As you examine your procedures, keep an eye out for both possibilities. That way, fast wins from “should be” will pay off quickly, and you’ll have a plan in place for the longer-term dramatic impact of your “could be” business process.
Noon Dalton is your dedicated resource to provide remote teams. Contact us today for more information.
See our professional BPO services here, including:
- Sales Support
- Customer Support
- Recruitment Process Outsourcing
- Accounting & Bookkeeping
- Data Processing
- Insurance Processing
- Underwriting
- eCommerce
See our BPO case studies to see how we’ve helped businesses to grow.
